Plot segmentation
Segmentation of the ortho-mosaics into individual plots are key step to calculate phenotypic values for experiments in breeding and agriculture. The manual step requires users interactively create plots on the web interface or inject plots from RESTAPI.
Terminology
Source is the method to create plots. PhenoCopter implements two methods (i.e. boundary of experiment and flight from in the same field).
Trial is a group of plots which refers to whole experiment, a block of experiment or any part of experiments. Trial name have to unique in each flight.
Boundary is the outline of an experiment layout and can further segment into individual plots. A boundary is quadrilateral and defined by four corners.
Row and Column refer as the experiment layout and have the alternative names in some of experiment design tools (e.g. Range and Plot).
Gap in Row and Column is used if the layout has a big gap in the row and column. The unit of Gap is the ratio along the Row and Column. However, it will be better to keep the gaps to calculate the height with DSM. The Trim can be used the same purpose, but keep the gaps in the further analysis.
Plot refers as the individual plot in a trial and is identified by Row and Column in the experiment layout.
Trim is used to remove parts of plot in the further calculation depending on the functions. See workflow extract phenotypic values for more details.
In each flight, multiple trials can be defined using methods below. The trial names have to be unique and only contain alphabet, number and underscore. The unique name is automatically generated when a trial is created. The name can be changed through clicking the title of each trial. There are no links between trials and methods to generate these trials. A trial is defined as a group of plots. Here two methods are provided to generate a trial.
Create new plots from boundary
Create a new boundary
The boundary method can be used if the experiment layout is a regular rectangle (i.e. quadrilateral in general). The boundary can be defined for whole block through drawing a polygon in the four corners.
Before drawing a boundary, you will need to determine
- The starting corner of your experiment layout (Row 1 and Column 1 in general)
- The direction of Row and Column
- The number of Rows and Columns
Steps to create a new boundary
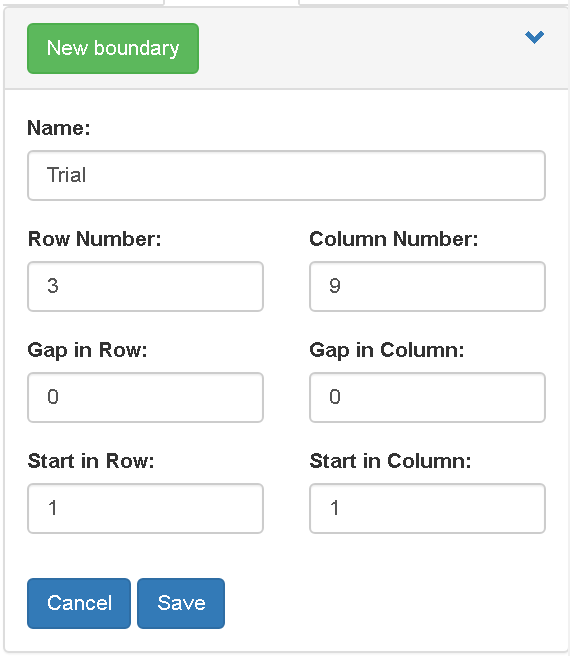
Edit the information in the new boundary area and click New Boundary button.
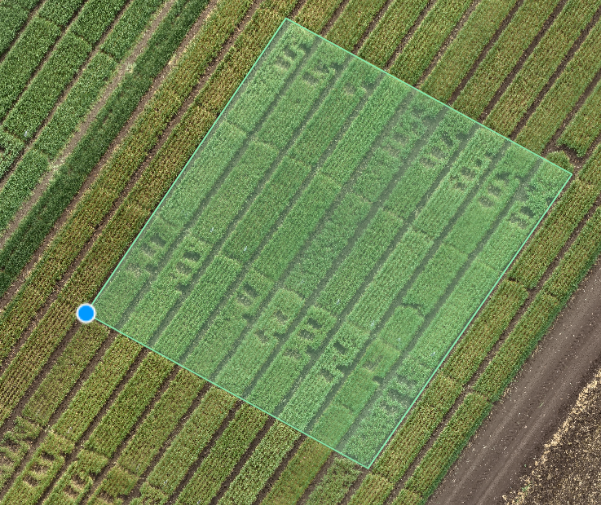
![]()
Create a new boundary A blue cursor is showing if mouse overs the map.
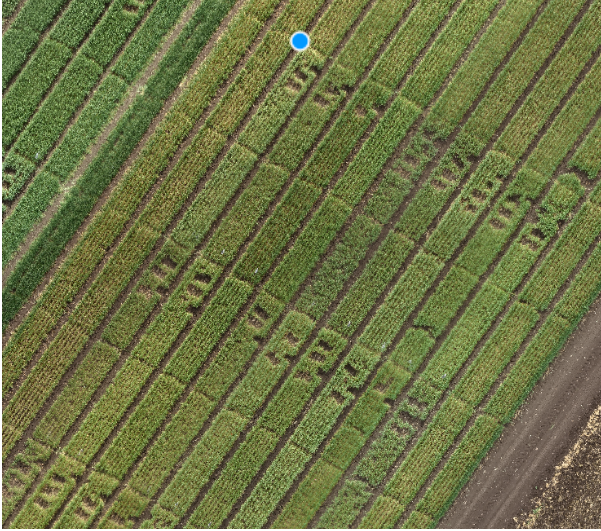
Click the first point at the starting corner (Row 1 and Column 1 in general)
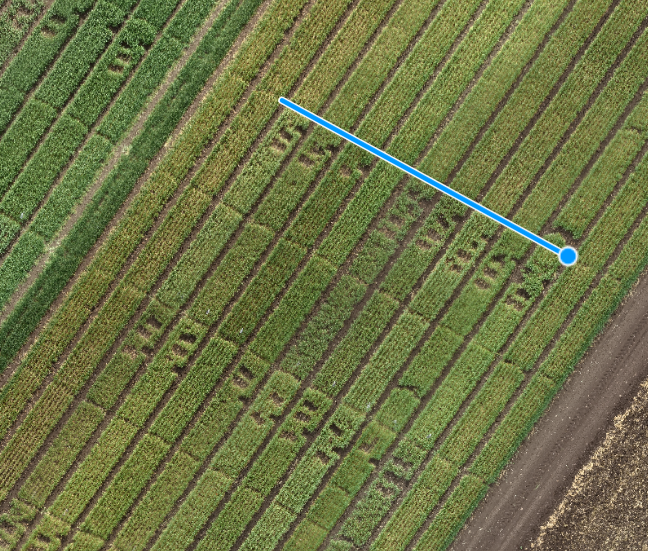
- Click the second point along the Column side.
- Click the third point at the diagonal direction of the first point.
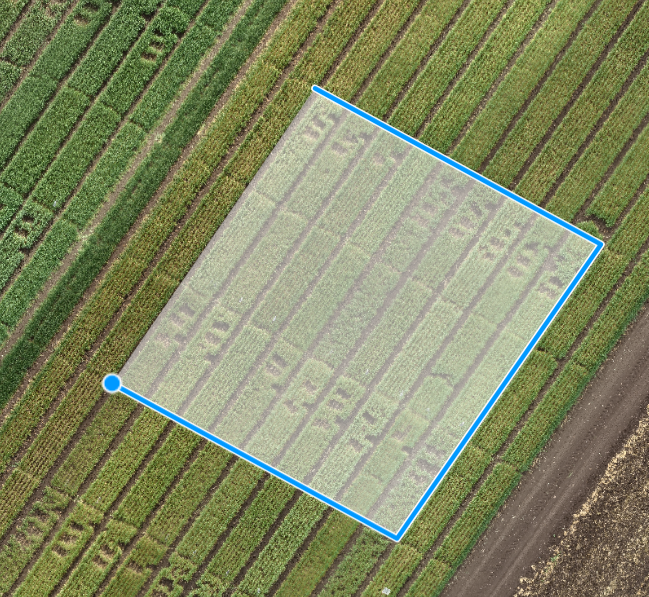
- Click the forth/final point at the diagonal direction of the second point. The polygon will automatically close and segment the whole polygon according to parameters.
- Click Save button to save the polygon.
Edit a boundary
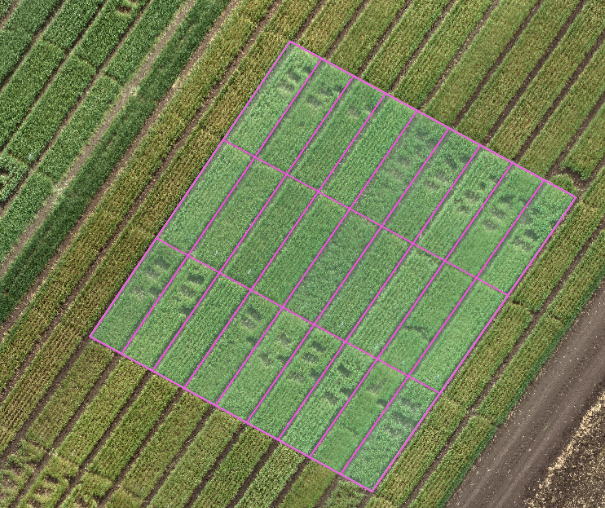
After a new boundary is created, a boundary panel is added into Boundary tab. The boundary polygon is separated into the number or row and columns (Row + 1 and Column + 1 lines in two directions of polygon). No plot polygons are created in this step.
Now you can
- Edit the boundary name by clicking the title of panel. The boundary name has to be unique in each flight and only contain alphabet, number and underscore.
- Edit the parameters in the input boxes. The layout will be automatically updated.
- Adjust colors for the boundary and gaps. The new colors are saved into system and are retrieved when page reloads.
- Delete boundary from system. The created new plots are kept.
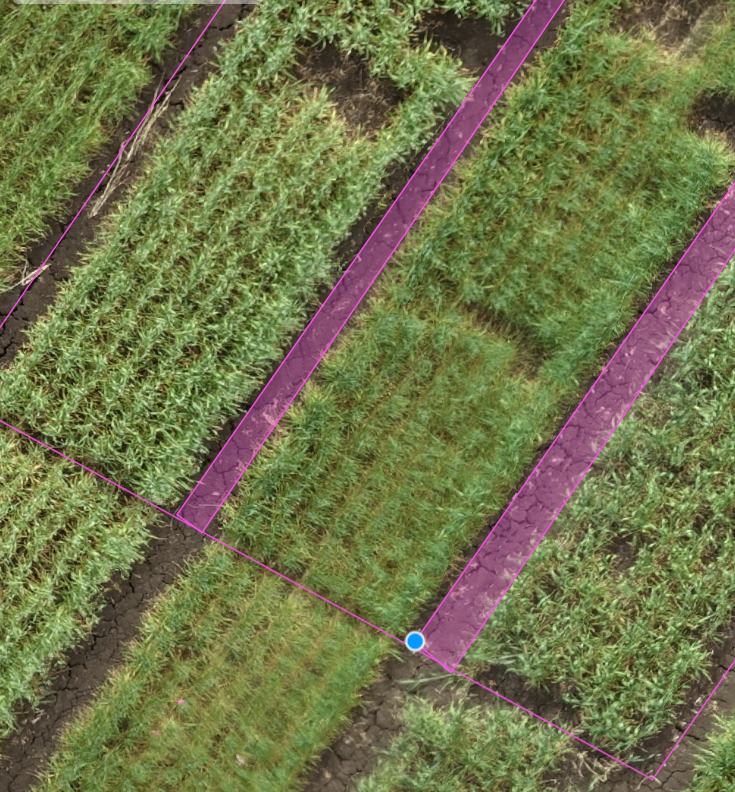
- Edit boundary. A Blue cursor is showing when mouse moves over corners. You can drag the corner and drop into a new place to update the boundary. Zoom into your ortho-mosaic provide more accurate position of corners.
- Edit gaps. A blue cursor is showing when mouse moves over to intersection of lines. You can drag the intersection and drop to edit gaps. Be carefully to use this feature as you might get strange polygons for plots.
- Create new plots from boundary by clicking New Plot button.
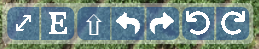
The Undo and Redo at the top of map can be used during editing boundary and gaps.
Edit boundary will overwrite any changes of edit gaps.
There are no link between boundary and trials after new plots are created. Any editing of plots will be lost if new plots are created from same boundary.
Copy plots from other flights
If the ground control points are used in the same field (i.e. experiment in a season) and added into each flight, the plot segmentations can be copied from other flights.
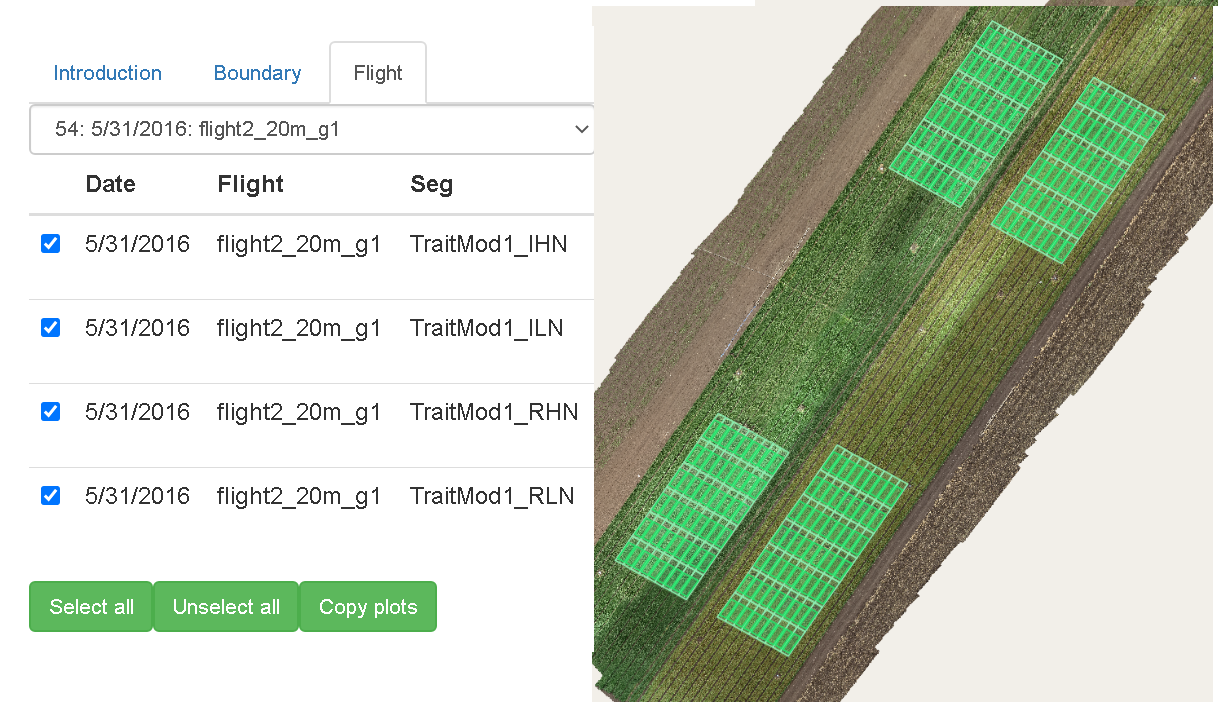
After switching to the Flight tab in the Source panel, the dropdown menu shows a list of flights which have the plot segmentation in the same field.
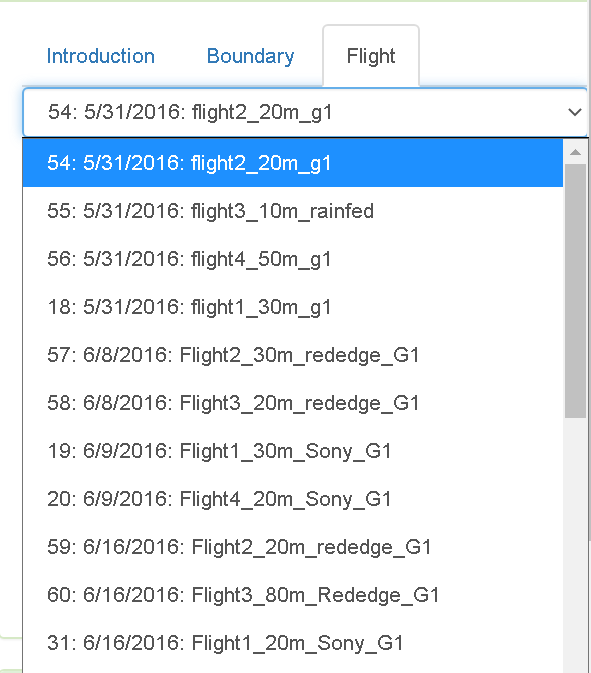
You can switch the flight to show the list of plot segmentation and update the map to show all plots. The check boxes at the left can be used to select the trials. Finally, the Copy plots button is used to copy the plots into this flight.
Inject plots using RESTAPI
If you have the plot segmentation in the geojson format, you can use the RESTAPI to POST your data into flight. See the API documentation for details.
Edit plots
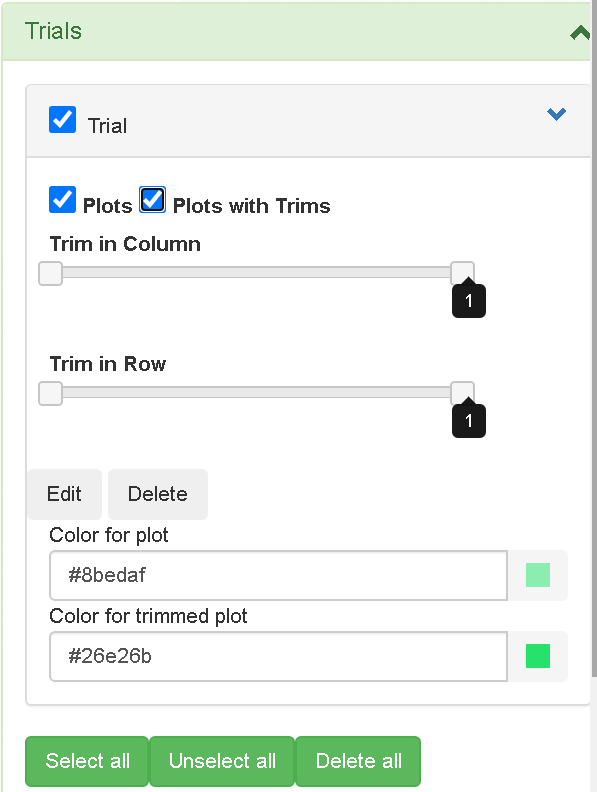
In the trial panel, you can setup the trim in the row and column directions, change the color of plots and plots with trims, delete trial, and edit plots.
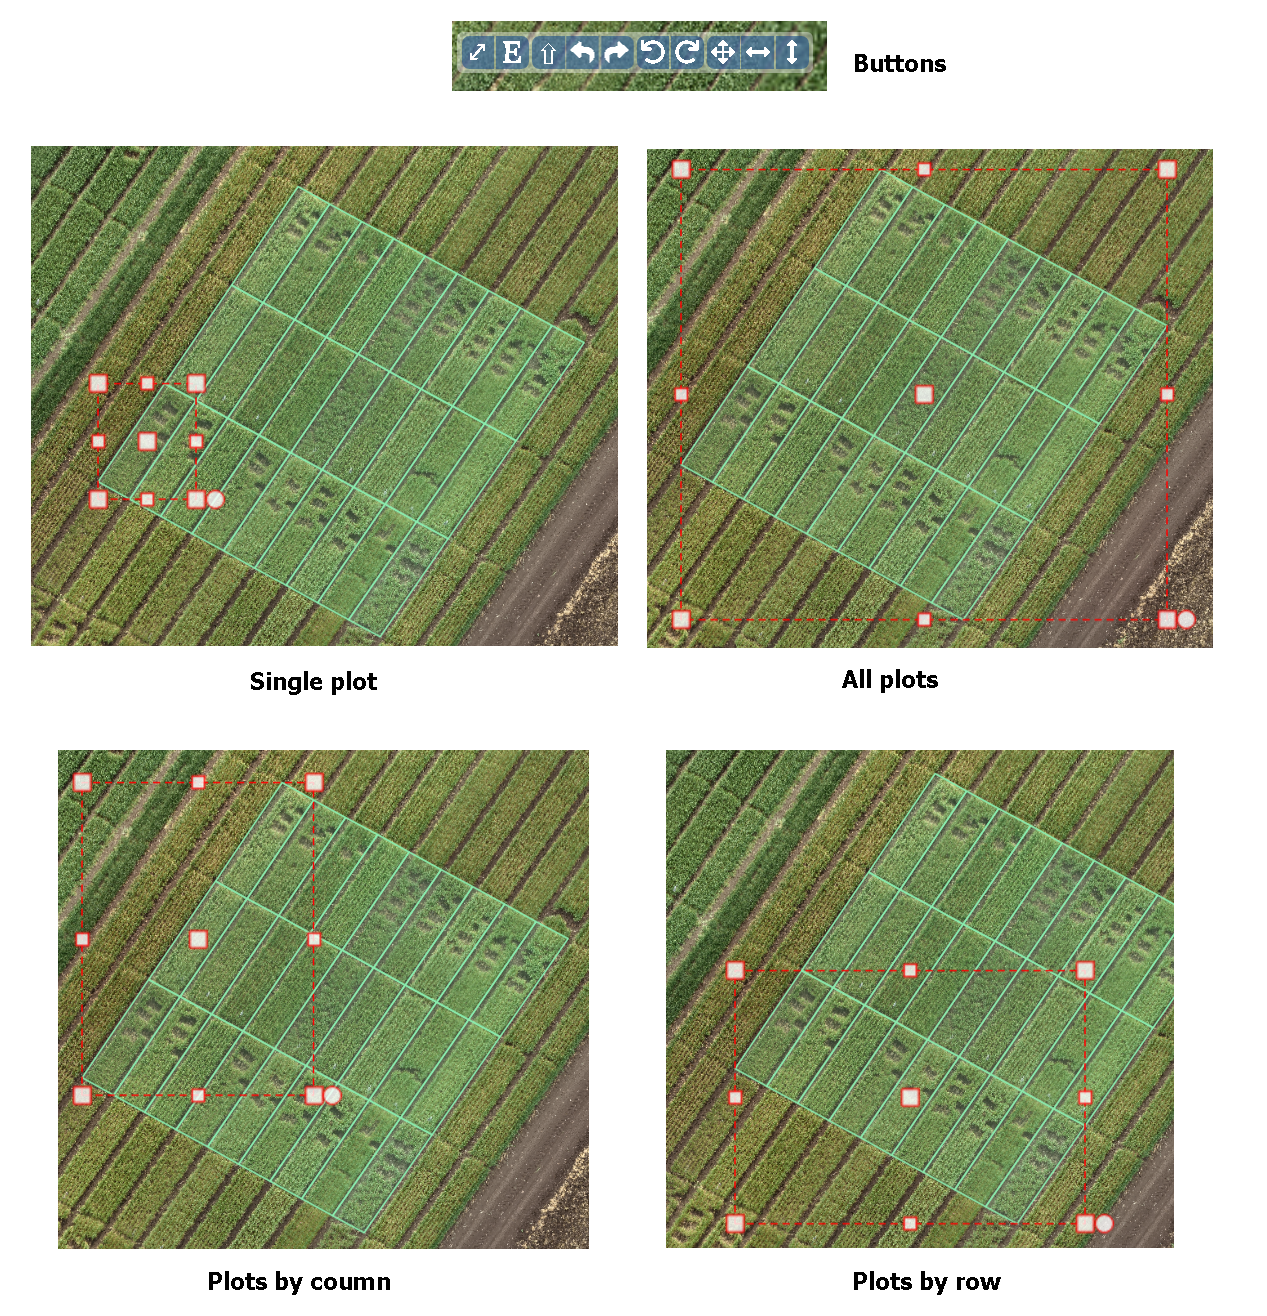
Plots can be edited in the Trials panel. The edit feature is implemented using transform feature in the ol-ext library to scale, translate, rotate and stretch the selected plots. See ol-ext documentation for details.
After clicking the Edit button under each trial panel, you can select a single plot by mouse click on the map, then single row, single column and all plots through button at the top of map. The edit can be undo and redo using the buttons at the top of map.
After editing, you can Save or Cancel all changes.
Workflow
The workflow Plot segmentation has to been manually triggered when all plots are created. The individual plots are extracted from ortho-mosaics and vegetative index for the further analysis. The thumbnails can be viewed for each plot after workflow is finished through right clicking on the map.